
“OPEN” by mag3737 is licensed under CC BY-NC-SA 2.0
Is OSS right for your execution model?
Open source software is incredible. I’ve certainly achieved a lot more in my career by being able to leverage libraries and frameworks that other people have invested a lot of personal time into. For that I’m very grateful. What’s curious about the open source package selection process though, is that we put considerable thought into the licensing of a given package, review the documentation, question the project’s maturity, consider how active the community around it is and try to find out how steep the learning curve might be.
How much time and consideration do we give as to whether the package is right for our chosen execution model. I didn’t consider that question recently and I wish that I had.
Context is king
My client had an automated process that would cancel a customer’s order if it didn’t reach a certain state within 10 minutes of order placement. Needless to say, this resulted in a not insignificant number of “lost orders”. A theory spawned that if some form of automated intervention could be introduced (five minutes after order placement) then a reduction in the lost order rate could be achieved and thus a reduction in lost revenue achieved.
I was tasked with building a new service that would review the state of an order five minutes after placement and where the order hadn’t transitioned to the desired state the service would contact the customer. Further to that, I was tasked with running it as an experiment. As per any good experiment, I needed a control group in order to determine the effectiveness of the automated intervention. It was suggested that the service should contact a customer in 50% of all possible cases, allowing us to determine whether the automated intervention positively influenced the behaviour of the recipient (when compared with the outcome from the 50% of customers not contacted).
I built the initial service in two weeks, with a further week spent configuring Twilio and cementing the logic around the experiment. The underlying technologies that I used were:
- AWS Lambdas (using the Serverless framework and an SQS trigger).
- Twilio to call the customer and to play an automated message.
- Optimizely for bucketing orders in to a call/do not call group (I leveraged a library developed by another team within the organisation which abstracted away some of the integration complexities) .
- BigQuery. My client used BigQuery as their go to data warehouse in the cloud. The new service only had to publish messages to help distinguish between the various outcomes of the experiment. The data that was captured was later used to analyse the experiment.
After several days of running the new service in production, I decided that I wanted to review the logs and the graphs in greater depth*. What I saw baffled me and my clients team.
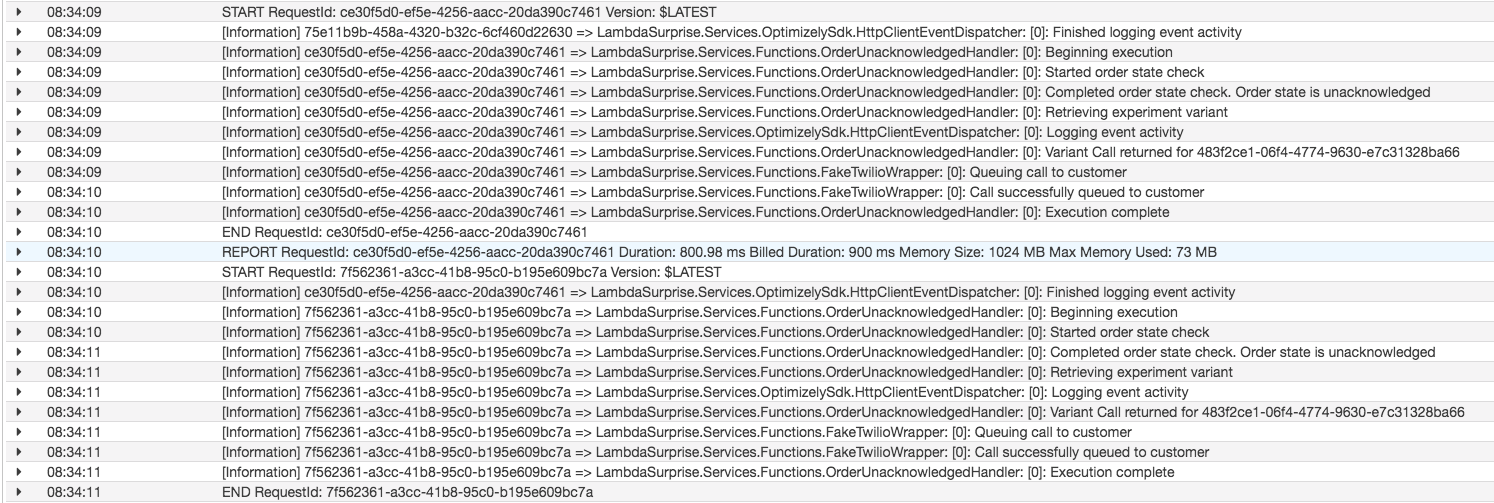
Fig. 1.0 – CloudWatch logs from a lambda that I built to replicate the problem
You’ll be forgiven for not seeing the problem.
- Firstly, it is that I designed the logging statements to be in pairs (“Started order state check” is paired with “Completed order state check”) in an effort make it easy to support the system. So…. given the code to replicate the problem, why is “Finished logging event activity” before it’s opening “Logging event activity” log statement pair?
- Secondly, why is the identifier for the “Finished logging event activity” log statement different to that of the other log statements from the same lambda execution (all statements should correlate as I’m using .net core logging scopes to log the AwsRequestId).
You can also see (with a little bit of concentration) that the “Finished logging activity” log statement with the identifier ending c7461 actually came from the previous lambda execution.
The problem that I faced at my client was far more acute than can be seen from the above cloud watch logs (the scenario was replicated for the purpose of this blog post), in part due to the scale of the system. I had a lambda that took < 10 seconds to execute, but could see related log statements that could be anything from minutes apart all the way to being as far apart as an hour. Initially I thought there was a problem with Kibana, so I sought help and we manually reviewed lots of logs in CloudWatch. Several hours of thinking about it, reviewing code, reviewing logs and then thankfully one of my client’s engineers stumbled upon the cause of the problem.
Background threads have no place in lambda functions
As noted above, I’d used an internally developed library that provided an abstraction around the Optimizely C# Sdk. It made the adoption of Optimizely simpler and it had already been successfully adopted by a number of teams. What I didn’t know however, was that I was the first person to use the library in an AWS Lambda. I’m pleased to say that root cause wasn’t in the internally developed library. It was in the underlying Optimizely SDK. This one line of code (line 8 below) caused several hours of confusion.
Fortunately for me the code in the Optimizely SDK that gets executed on a background thread is there to record impressions, events used to “calculate your campaign and experiment metrics”, a feature we weren’t using and so delayed execution didn’t cause us an issue.
In the README for the aws-logging-dotnet github project, Norm Johanson articulates really well why background threads have no place in AWS Lambda functions . With reference to the various supported logging frameworks, he wrote.
“These packages batch logging messages in a queue and send messages to CloudWatch Logs using a background thread. The use of the background thread means that the messages are not guaranteed to be delivered when used in AWS Lambda. The reason is because the background thread will be frozen once a Lambda event is processed and may not ever be unfrozen if more Lambda events are not received for some time.“
Summary
The technologies that I used to fulfil my clients needs ensured that I could iterate quickly. Within 3 weeks I’d taken an idea, built a service and captured the data required to determine if the experiment proved that automated intervention could reduce lost revenue. And it did, with a predicted annual revenue gain in the region of £500,000.
However, on reflection i feel that I got lucky. The issue caused by the background thread in the open source SDK caused confusion, but nothing more sinister. In a different service, maybe something with financial implications where the timeliness of code execution is paramount, the impact could be hugely significant.
So…… the next time your choosing an open source package to use, give some consideration to your execution model and whether the code in the package fits that model.
Links:
- The repository containing the code used to replicate the above scenario can be found here.
*Recording metrics and building graphs for observability was standard with each development effort. We used StatsD, Graphite and Grafana for graphs and ELK for our logging stack.
